-

The Global Vegetation Project
Enabling visual and interactive experiences that link vegetation and climate at the global scale.
Imagine being able to explore vegetation anywhere in the world, anytime.
Mission:
The mission of the Global Vegetation Project is to inspire and empower people of all ages to learn about the diversity of vegetation on our planet and to provide educators with a resource for teaching online. We aim to bring the field into the classroom in a way that was previously impossible, enabling visual and interactive experiences that link vegetation and climate at the global scale.

Vision:
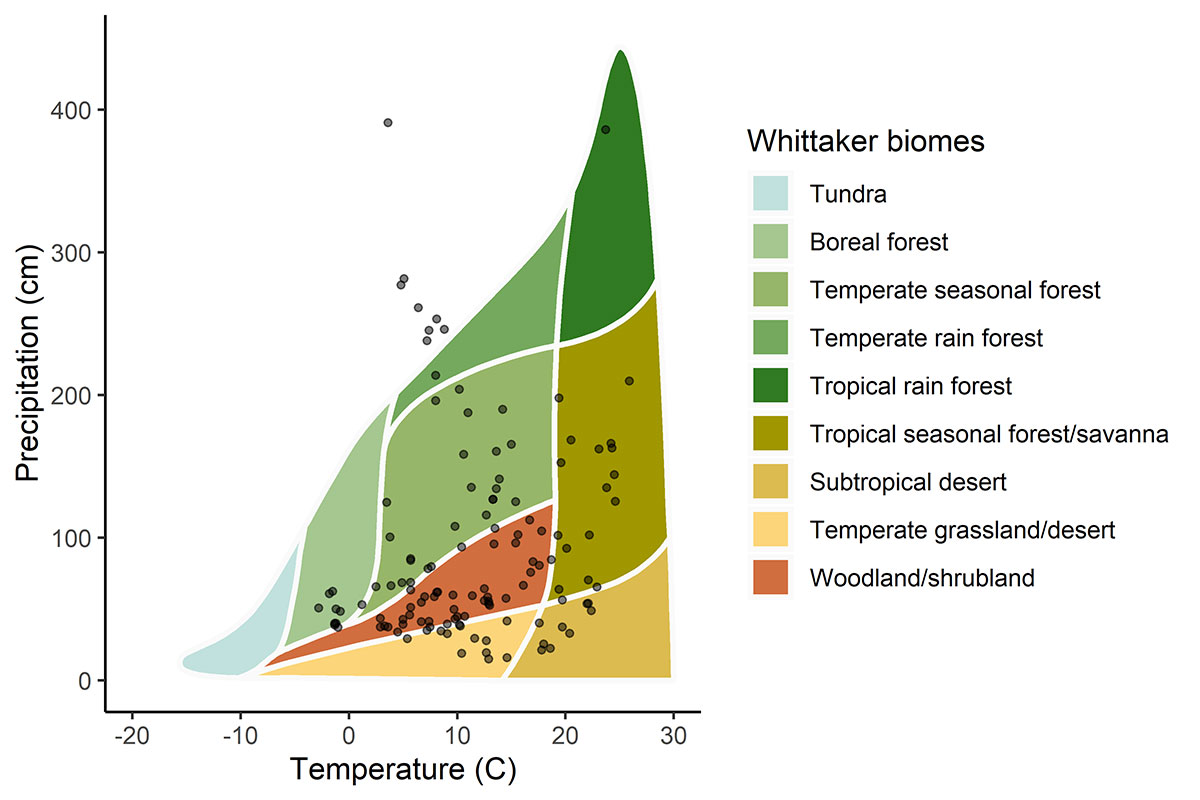
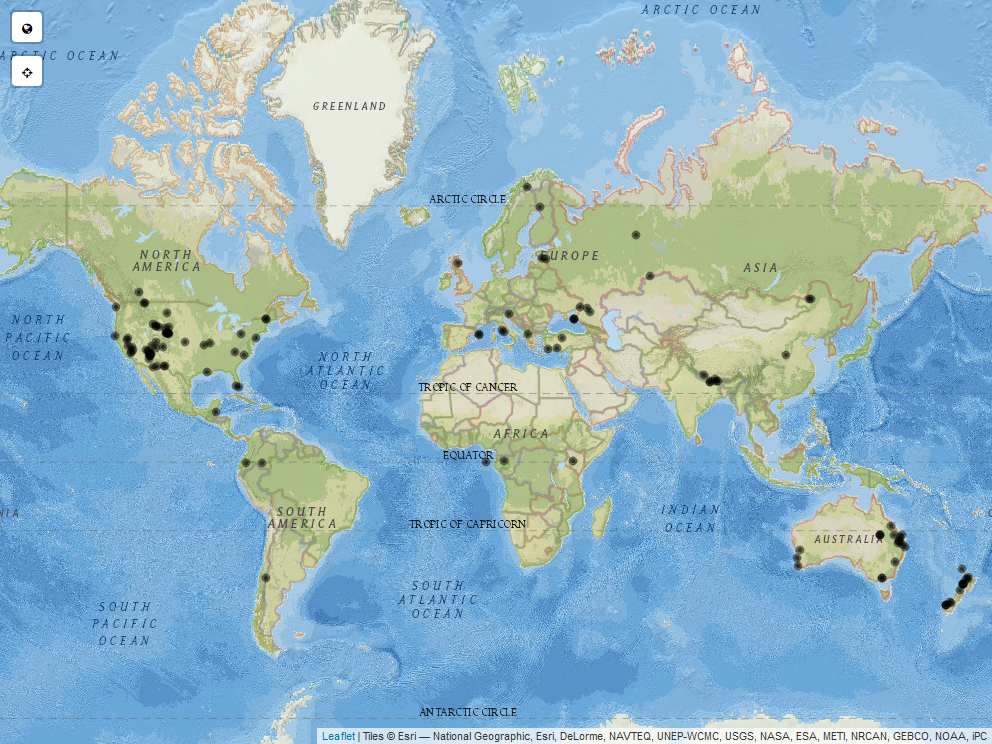
The long-term vision is to curate a database of vegetation photographs that can be explored interactively through an online interface. Anyone with an internet connection will be able to challenge themselves to tackle a variety of learning outcomes such as: 1) determining differences and similarities between vegetation types across the globe, 2) understanding how climate shapes vegetation, and 3) hypothesizing how climate change might affect the distribution of vegetation types in the future. This project was inspired both by the increased need for online field ecology teaching resources as well as the lack of a single e-repository with information on the diversity of vegetation types across the globe. The project is similar to iNaturalist but with a focus on communities of plants (i.e., vegetation) rather than individual species. With the help of user submitted photos, location information, and vegetation information, the Global Vegetation Project will create an interactive map where “travelers” can virtually navigate to points to explore vegetation types. Travelers can explore using a global map (see figure) or by using a Whittaker biome diagram (see figure) which illustrates how vegetation types relate to temperature and precipitation. Alternatively, vegetation can be viewed by filtering for ranges of temperature, precipitation, or biomes.
Our goal is to turn this graph black - (click to enlarge) to fill it with photo locations until you cannot even see the background! This illustrates the current distribution of photo points in relation to mean annual temperature and precipitation submitted to the Global Vegetation project prior to April 26
You can support the Global Vegetation Project by following our social media accounts @GlobalVegProj on Twitter, Instagram, and Facebook
The Global Vegetation Project is in development and you can help make it a success! Please submit your photos and information here to be included in the interactive map.
Both applications are currently optimized for desktop use. Mobile support will be prioritized in a future release.
Data Storage and Protection:
The photo submission portal is protected by reCAPTCHA. After photos are submitted, we validate the photos for quality control purposes (this step can take a few days), then we use the spatial coordinates to link the photo to long-term climate patterns, biome, and ecoregions.
Each Global Vegetation Project submission is stored within a Microsoft SQL Server relational database and our associated cloud file storage server. Image attributes are written to relational tables within the database, with records having the image metadata as well as the cloud storage URL to the image file. These data are backed up nightly to an offsite location and maintained for at least 15 days. The GVeg API is built upon ASP.NET, and provides multiple end points for data retrieval. The API conducts validation of each POST to ensure minimum data requirements are met. To provide security for each user-supplied image, the API provides an on-demand temporary token to view each image, with the token expiring after one hour. The Advanced Research Computing Center (ARCC) provides robust cyber-infrastructure that the Global Vegetation Project uses for its data visualization and storage needs. This includes the open-source software Shiny-Server from RStudio running on a fault tolerant virtual machine, 100 gigabit networking, and S3 storage through the open-source Ceph project.

